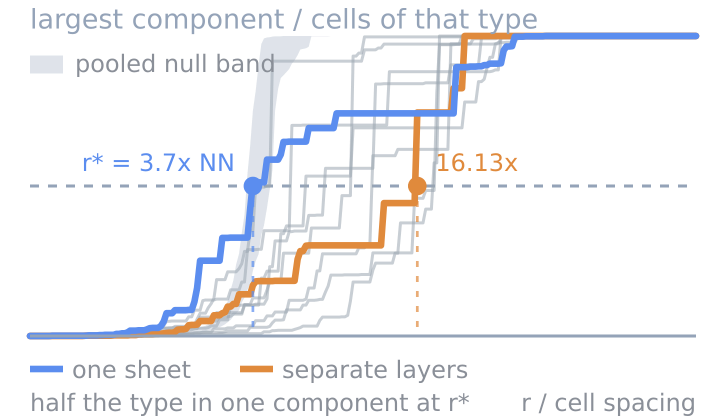
Cell-Type Percolation
Whether a cell type is one connected mass or many islands.
Verified: passed 9 of 9 gates
v1.0.0
4 downloads

by PointillViz community tools
Which cells one cell type seals off from the rest of the tissue.
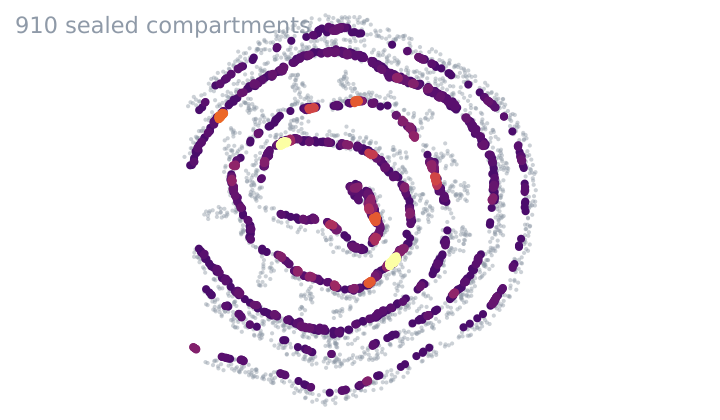
Answers the question: Which cells does one population seal off from the tissue surface or from another population?
The tool lets the user select one population as a potential barrier and choose a destination for the remaining cells: either the exposed tissue surface or another population. It then identifies which cells can no longer reach it when the barrier is impassable.
To identify possible routes through the tissue, the tool first connects the cells in each section using a Delaunay triangulation. Three cells form such a triangle if a circle can pass through all three centers without enclosing another cell center.
Multi-source Dijkstra routing calculates the shortest network distance to a source with the selected population passable, , and with it treated as impassable, . is the straight-line distance from cell to the nearest source cell, ignoring the network.
A cell is sealed if it loses its route when the selected population becomes impassable. For cells that remain reachable, measures the added network distance in median cell spacings , while compares the remaining route with the straight-line distance:
Map. The user can choose between three display modes:
Sealed compartments colors only sealed cells. Dark colors indicate smaller compartments, while bright yellow indicates compartments containing more cells.Extra path colors only reachable cells whose route becomes longer. Dark colors indicate a small additional distance, while bright yellow indicates that the barrier adds many cell spacings.Detour factor colors only reachable cells with a valid . Dark colors indicate a route close to the direct distance, while bright yellow indicates a much longer detour.Plot. The x-axis shows cell percentiles after ranking by ; at percentile , the curve gives the detour factor that of the evaluated cells do not exceed. The y-axis shows , the network distance divided by the straight-line distance.
The red curve shows detour factors when the selected population is impassable, while the dashed curve shows the same tissue with it passable. The grey band shows the results when the same number of randomly selected cells are treated as barriers. If the red curve stops before the right edge, the missing percentage corresponds to sealed cells; their detour factors are non-finite and therefore not shown.
Table. Each row summarizes one population with at least 25 eligible cells, and Cells gives its total cell count. For the selected barrier and destination, Enclosed and % enclosed show the number and proportion of eligible cells that lose their route. Among cells that remain reachable, % detoured shows how often the route becomes longer, while Extra path where detoured gives the median number of cell spacings added to those longer routes. % enclosed, random barrier gives the average expected with equally large random barriers.
| Parameter | Type | Default | What it does |
|---|---|---|---|
Grouping columnfield |
categorical_field | optional | Selects the annotation used to define the barrier and source populations. Defaults to the dataset’s cell-type column. |
Barrier cell typebarrier |
category_value | — | Selects the population treated as an impassable barrier. |
Route towardssource |
select, 2 options | The tissue’s exposed surface | Selects the routing destination: the exposed tissue surface or another cell population. Surface cells are identified along the section boundary and beside sufficiently large gaps. |
Source cell typesource_type |
category_value | optional | Selects the destination population when routing towards another cell type. It must differ from the barrier population. |
Barrier half-widthbarrier_width |
float, 0–3 | 0.75 | Sets how closely a path may approach a barrier-cell centre, measured in median cell spacings. Larger values treat the barrier as thicker. |
Largest gap a path may crossmax_gap |
float, 1.5–20 | 5 | Drop Delaunay edges longer than this many median cell spacings, so no route crosses a lumen or tissue gap. |
Map showspaint |
select, 3 options | Sealed compartments (size in cells) | Selects whether the map displays sealed-compartment size, additional path length or detour factor. This does not change the calculation. |
Random barriersn_null |
int, 2–20 | 5 | Sets how many equally large random barriers are used for the grey plot band and the random-barrier comparison. |
The nine gates this version passed when it was published.
Passed 9 of 9 gates
bundle
pass
4 files, 36.5 kB packed and 211.5 kB unpacked, plugin.json at the root.
manifest
pass
tissue-permeability 1.0.0 by PointillViz community tools; entry tool.py, outputs summary, cells, series, table, 120 s and 2048 MB budget.
entry
pass
tool.py imported in 0.20 s and defines run(ds, params).
imports advisory
pass
1 Python file, importing __future__, backend, numpy, scipy; no network, subprocess, filesystem-write, dynamic-exec or environment use found.
fixture
pass
ran on the 600-cell fixture in 0.39 s of its 120 s budget, returning summary, cells, table, series.
result
pass
returned the declared outputs: summary, cells, table, series.
determinism
pass
two runs with identical parameters produced byte-identical results (7.5 kB of JSON).
edge
pass
at the minimum corner (barrier_width=0.0, max_gap=1.5, n_null=2) it refused in words rather than crashing: Nothing here is more than one cell spacing from a source, so there is no route to measure and nothing is enclosed. At a gap of 1.5 spacings almost every cell counts as exposed surface — raise it, or route towards a cell type instead of the surface. (code: no_interior); ran at the maximum corner (barrier_width=3.0, max_gap=20.0, n_null=20, paint='tau', source='type') in 0.37 s.
no_mutation
pass
the fixture dataset's 4 files are byte-identical after every run (plugin_cache/, where ds.knn caches, is excluded by design).
Passed every required gate when this version was published. That is a statement about the gates, not about whether the code is safe to run.
Whether a cell type is one connected mass or many islands.
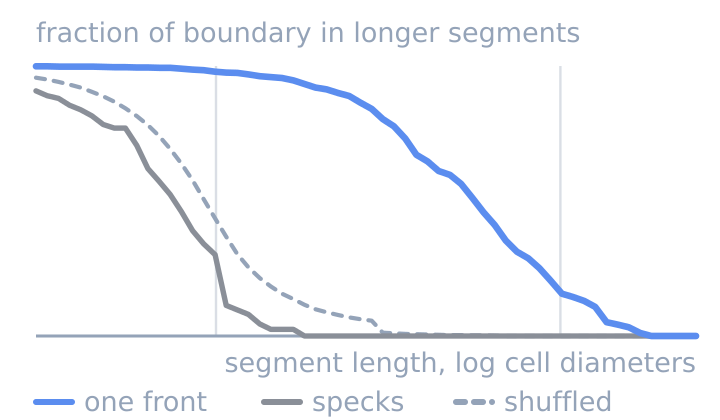
Whether two cell types meet along one front or in specks.
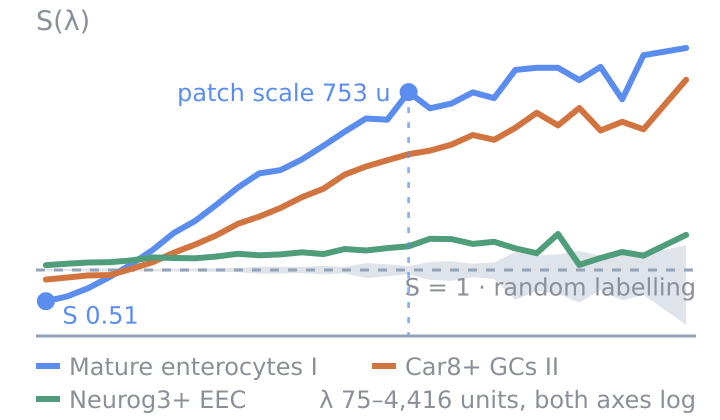
How clustered each cell type is, at every length scale.