Tissue Permeability
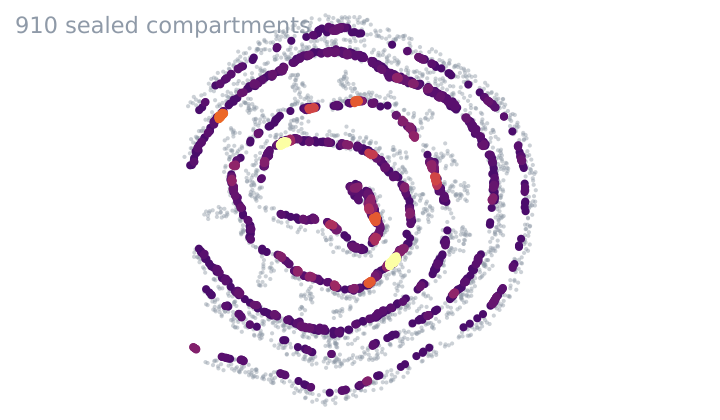
Which cells one cell type seals off from the rest of the tissue.
Verified: passed 9 of 9 gates
v1.0.0
4 downloads

by PointillViz reference tools
Whether a cell type is one connected mass or many islands.
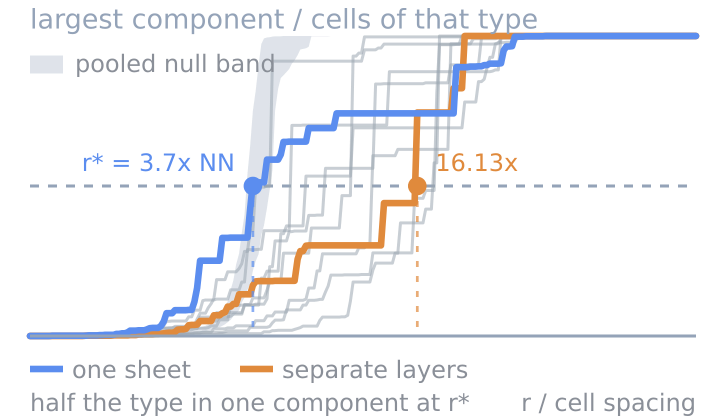
Answers the question: Which cell types form one connected structure, and which are split into separate patches?
For each group in the selected annotation, two cells are connected when they are no more than a distance apart. Connections can form chains: if cell A is connected to B and B to C, all three belong to the same patch. As increases, smaller patches merge into larger structures.
Map. Each cell is colored by the log10 size of its connected same-group patch at a fixed linking distance. Brighter colors indicate larger patches, darker colors indicate smaller patches, and unpainted cells have no result.
Plot. The x-axis shows the linking distance , normalized by the typical nearest-neighbor distance within each group. The y-axis shows the fraction of the group’s cells contained in its largest connected patch.
Each line represents one group. Curves rising further to the left indicate greater connectivity, while curves rising further to the right indicate greater fragmentation.
Table. The percolation threshold r* is the smallest distance at which the largest patch contains the selected fraction of the group, 50% by default. r*/NN expresses this threshold relative to the group’s own spacing. r*/null compares it with random groups of the same size: values below 1 indicate greater connectivity than expected, while values above 1 indicate greater fragmentation.
Stauffer, D. & Aharony, A. (1994). Introduction to Percolation Theory, 2nd ed. Taylor & Francis. Gower, J. C. & Ross, G. J. S. (1969). Minimum spanning trees and single linkage cluster analysis. Applied Statistics 18(1), 54-64.
| Parameter | Type | Default | What it does |
|---|---|---|---|
Grouping columnfield |
categorical_field | optional | Selects the annotation used to define the groups. |
Minimum cells per categorymin_cells |
int, 10–5,000 | 50 | Categories with fewer placed cells than this are not scored and appear unpainted (grey) on the map. |
Giant-component fractiongiant_frac |
float, 0.1–0.9 | 0.5 | Sets the fraction of a group that must belong to its largest connected patch to define the percolation threshold r*. |
Null drawsn_sims |
int, 0–49 | 19 | Sets the number of random groups used for comparison. More draws provide a more precise comparison but increase runtime; 0 disables the null results and grey band. |
Patch-map link radiuslink_scale |
float, 0.5–20 | 3 | Sets the distance used to define map patches. Cells are colored by patch size at that distance; the plot and r* are unchanged. |
Maximum cells per categorymax_per_type |
int, 5,000–200,000 | 40,000 | Limits runtime by reproducibly subsampling larger categories. Subsampling may change the map and threshold results. |
The nine gates this version passed when it was published.
Passed 9 of 9 gates
bundle
pass
4 files, 20.6 kB packed and 70.7 kB unpacked, plugin.json at the root.
manifest
pass
celltype-percolation 1.0.0 by PointillViz reference tools; entry tool.py, outputs summary, cells, series, table, 300 s and 2048 MB budget.
entry
pass
tool.py imported in 0.23 s and defines run(ds, params).
imports advisory
pass
1 Python file, importing __future__, backend, hashlib, numpy, scipy; no network, subprocess, filesystem-write, dynamic-exec or environment use found.
fixture
pass
ran on the 600-cell fixture in 0.52 s of its 300 s budget, returning summary, cells, table, series and 1 log line.
result
pass
returned the declared outputs: summary, cells, table, series.
determinism
pass
two runs with identical parameters produced byte-identical results (56.1 kB of JSON).
edge
pass
ran at the minimum corner (giant_frac=0.1, link_scale=0.5, max_per_type=5000, min_cells=10, n_sims=0) in 0.33 s; at the maximum corner (giant_frac=0.9, link_scale=20.0, max_per_type=200000, min_cells=5000, n_sims=49) it refused in words rather than crashing: No category has 5,000 cells with coordinates — the largest has 235. Lower the minimum-cells parameter, or pick a coarser annotation column. (code: no_types).
no_mutation
pass
the fixture dataset's 4 files are byte-identical after every run (plugin_cache/, where ds.knn caches, is excluded by design).
Passed every required gate when this version was published. That is a statement about the gates, not about whether the code is safe to run.
Which cells one cell type seals off from the rest of the tissue.
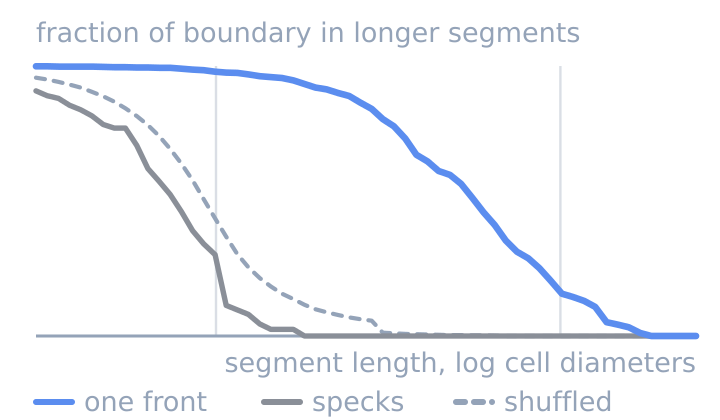
Whether two cell types meet along one front or in specks.
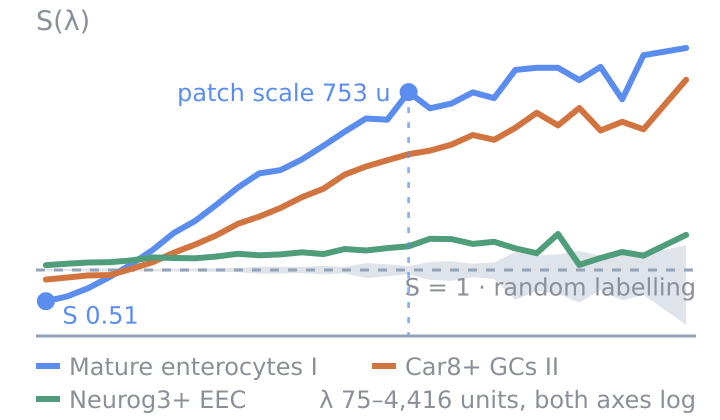
How clustered each cell type is, at every length scale.