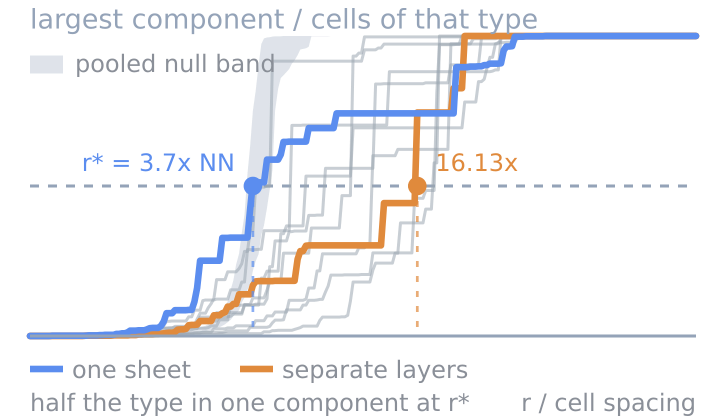
Cell-Type Percolation
Whether a cell type is one connected mass or many islands.
Verified: passed 9 of 9 gates
v1.0.0
4 downloads

by PointillViz reference tools
At what distance cell type B accumulates around cell type A.
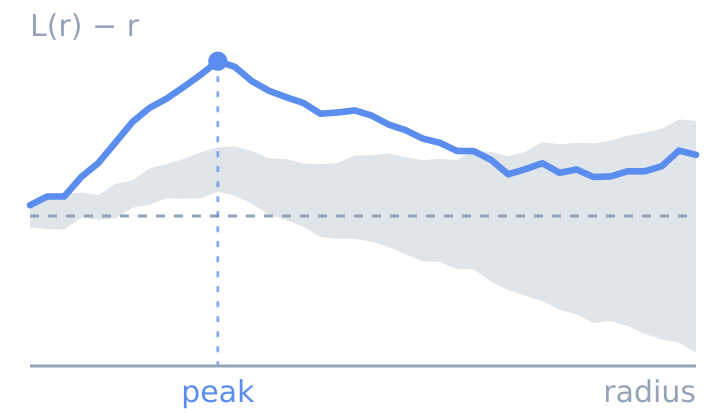
Answers the question: At what distances does group B accumulate around or avoid group A?
The tool uses group as the reference and measures the distances from its cells to cells from group . It gradually increases a radius around every -cell and counts how many -cells fall within that radius.
More specifically, let be the number of observed -to- pairs separated by at most . The cross-K function adjusts this count for the overall density of group and for , the number of -cells included at radius :
Under complete spatial randomness, . The tool transforms this comparison into a curve centered around zero:
Positive values indicate more -cells around than expected, while negative values indicate fewer.
Plot. The x-axis shows the radius , and the y-axis shows . The solid line is the observed curve; its peak indicates the spatial scale at which is most strongly accumulated around . The grey band comes from random redistributions of the labels while keeping fixed. Values above the band indicate enrichment of around , while values below indicate spatial avoidance.
Table. Each row represents one tested radius . L(r) − r is the observed curve value, while Envelope low and Envelope high are the lowest and highest values from the random relabellings at that radius. Outside envelope indicates whether the observed value lies above or below this range; a blank entry means that it lies inside.
Ripley, B. D. (1977). Modelling spatial patterns. Journal of the Royal Statistical Society, Series B, 39(2), 172-212.
| Parameter | Type | Default | What it does |
|---|---|---|---|
Grouping columnfield |
categorical_field | optional | Selects the annotation used to define the groups. Defaults to the dataset’s cell-type column. |
Group A (reference)type_a |
category_value | optional | Selects the reference group from which distances are measured. Defaults to the most abundant group. |
Group B (neighbour)type_b |
category_value | optional | Selects the group counted around group A. Defaults to the next most abundant group; A and B must differ. |
Maximum radiusmax_radius |
float, 1–5,000 | 150 | Sets the largest distance tested, in the dataset’s coordinate units. Keep it below about one quarter of the section’s shorter side to limit edge effects. |
Radius stepsn_steps |
int, 4–200 | 30 | Sets how many radii are tested between the smallest radius and the maximum radius. More steps produce a more detailed curve. |
Simulationsn_sims |
int, 5–999 | 39 | Sets how many random redistributions of the B labels are used to create the grey envelope. More simulations give a more stable envelope but increase runtime. |
Observation windowwindow |
select, 2 options | Convex hull of the cells | Defines the tissue area used to calculate density and correct for edges. The convex hull suits irregular tissue, while the bounding box suits a rectangular imaging field. |
The nine gates this version passed when it was published.
Passed 9 of 9 gates
bundle
pass
4 files, 14.5 kB packed and 37.2 kB unpacked, plugin.json at the root.
manifest
pass
ripley-cross-l 1.1.0 by PointillViz reference tools; entry tool.py, outputs summary, series, table, 120 s and 4096 MB budget.
entry
pass
tool.py imported in 0.20 s and defines run(ds, params).
imports advisory
pass
1 Python file, importing __future__, backend, hashlib, math, numpy, scipy; no network, subprocess, filesystem-write, dynamic-exec or environment use found.
fixture
pass
ran on the 600-cell fixture in 0.30 s of its 120 s budget, returning summary, table, series and 2 log lines.
result
pass
returned the declared outputs: summary, table, series.
determinism
pass
two runs with identical parameters produced byte-identical results (4.8 kB of JSON).
edge
pass
ran at the minimum corner (max_radius=1.0, n_sims=5, n_steps=4) in 0.53 s; ran at the maximum corner (max_radius=5000.0, n_sims=999, n_steps=200, window='bbox') in 0.94 s.
no_mutation
pass
the fixture dataset's 4 files are byte-identical after every run (plugin_cache/, where ds.knn caches, is excluded by design).
Passed every required gate when this version was published. That is a statement about the gates, not about whether the code is safe to run.
Whether a cell type is one connected mass or many islands.
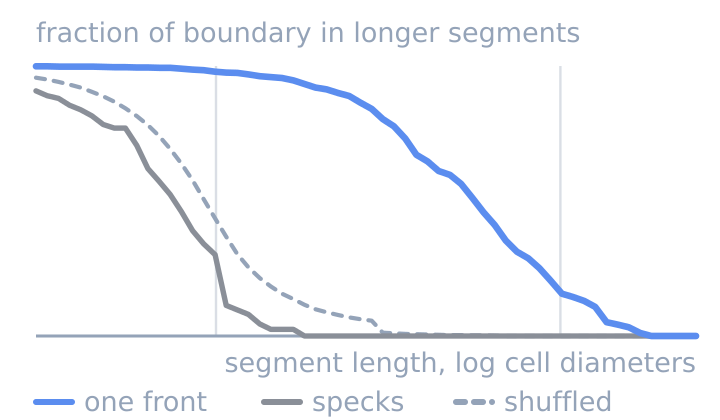
Whether two cell types meet along one front or in specks.
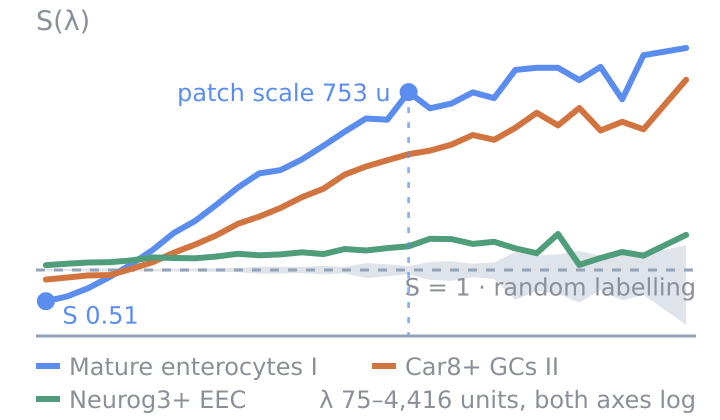
How clustered each cell type is, at every length scale.