Cell-Type Co-occurrence
Which cell types are found near each other more often than expected by chance.
Verified: passed 9 of 9 gates
v1.2.0
1 download

by PointillViz reference tools
How mixed each cell’s neighbourhood is, and who sits next to whom.
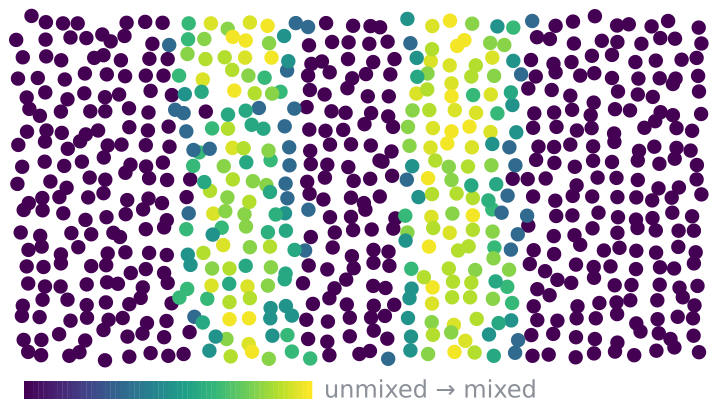
Answers the question: How mixed is each cell’s neighbourhood, and which groups occur next to one another more or less often than expected?
For each cell , the tool finds its nearest neighbours and records how many belong to each group.
Map. Each cell is colored by the normalized Shannon entropy of its neighbourhood:
Here, is the proportion of cell ’s labelled neighbours belonging to group , and is the number of groups present in the dataset. A score of 0 means that all labelled neighbours belong to the same group. Higher values indicate that several groups are represented more evenly.
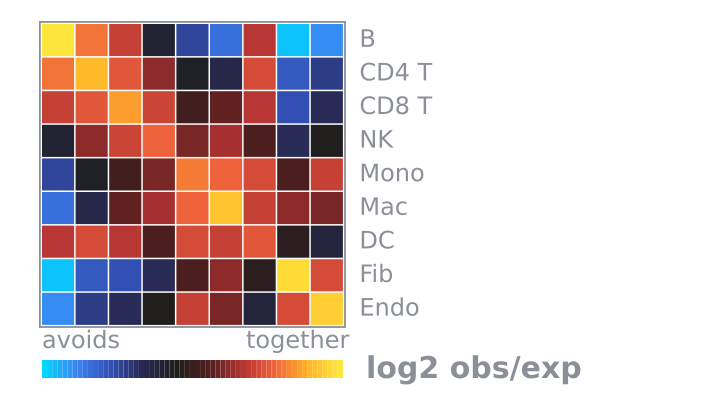
Matrix. Both axes list all groups. Each square compares the observed number of -to- neighbour relations with the expected number :
A score of 0 means that the observed and expected numbers match. Scores of +1 and −1 indicate approximately twice and half the expected number, respectively.
The expected number is calculated by multiplying the total number of valid neighbour positions around all -cells (usually about × ) by the proportion of valid neighbour positions across all groups occupied by -cells. Because the calculation counts neighbour positions rather than unique cells, the same cell may be counted multiple times, depending on its position and how many other cells include it among their nearest neighbours.
Table. Each row summarizes one group. Cells scored is the number of its cells with a valid mixing score, while Mean mixing is their average . Self log2 O/E is the group’s diagonal matrix value and indicates whether its cells cluster together or are more dispersed. Most enriched neighbour is the other group with the highest matrix score, and the accompanying log2 O/E column gives that score.
Shannon (1948) Bell Syst. Tech. J. 27:379-423; Pielou (1966) J. Theor. Biol. 13:131-144.
| Parameter | Type | Default | What it does |
|---|---|---|---|
Neighbours (k)k |
int, 3–100 | 15 | Sets how many nearest cells define each neighbourhood. Larger values measure mixing over a broader area and produce a smoother result. |
Grouping columnfield |
categorical_field | optional | Selects the annotation used to define the groups. Defaults to the dataset’s cell-type column. |
Minimum cells per categorymin_type_cells |
int, 0–5,000 | 25 | Categories with fewer cells are not shown in the matrix or table, but are still included in each cell’s mixing score. |
The nine gates this version passed when it was published.
Passed 9 of 9 gates
bundle
pass
4 files, 15.3 kB packed and 56.7 kB unpacked, plugin.json at the root.
manifest
pass
neighborhood-composition 1.1.0 by PointillViz reference tools; entry tool.py, outputs summary, cells, matrix, table, 300 s and 4096 MB budget.
entry
pass
tool.py imported in 0.20 s and defines run(ds, params).
imports advisory
pass
1 Python file, importing __future__, backend, math, numpy; no network, subprocess, filesystem-write, dynamic-exec or environment use found.
fixture
pass
ran on the 600-cell fixture in 0.28 s of its 300 s budget, returning summary, cells, table, matrix and 1 log line.
result
pass
returned the declared outputs: summary, cells, table, matrix.
determinism
pass
two runs with identical parameters produced byte-identical results (13.3 kB of JSON).
edge
pass
ran at the minimum corner (k=3, min_type_cells=0) in 0.29 s; at the maximum corner (k=100, min_type_cells=5000) it refused in words rather than crashing: No two categories have at least 5000 cells with coordinates, so there is no composition matrix to build. Lower 'Minimum cells per category'. (code: no_types_pass_floor).
no_mutation
pass
the fixture dataset's 4 files are byte-identical after every run (plugin_cache/, where ds.knn caches, is excluded by design).
Passed every required gate when this version was published. That is a statement about the gates, not about whether the code is safe to run.
Which cell types are found near each other more often than expected by chance.
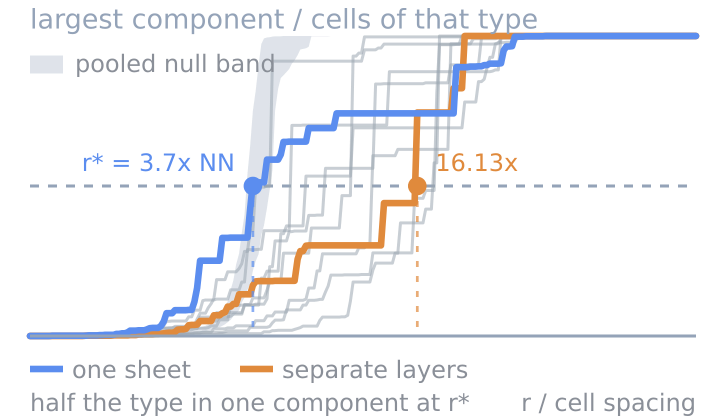
Whether a cell type is one connected mass or many islands.
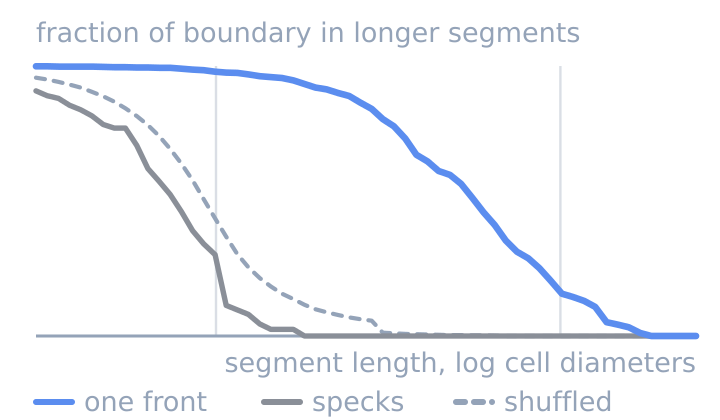
Whether two cell types meet along one front or in specks.