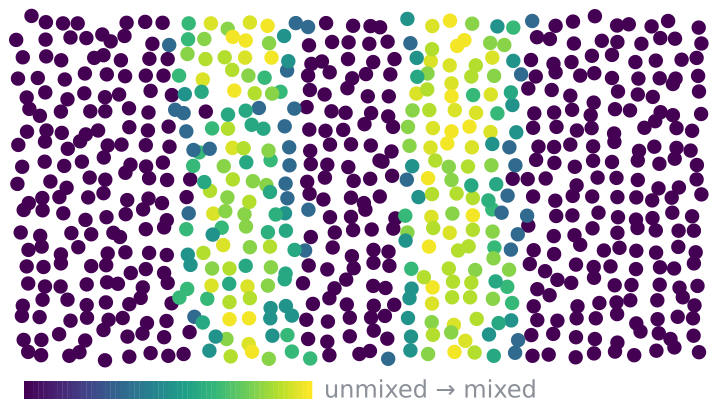
Neighborhood Composition & Mixing
How mixed each cell’s neighbourhood is, and who sits next to whom.
Verified: passed 9 of 9 gates
v1.1.0
1 download

by PointillViz reference tools
Which cell types are found near each other more often than expected by chance.
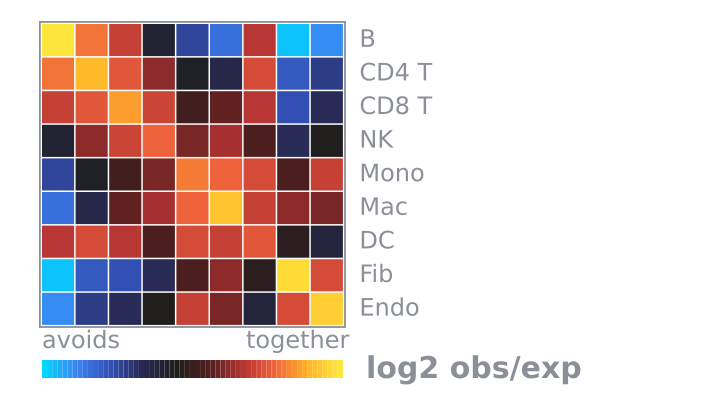
Answers the question: Which cell types are found near each other more often than expected by chance?
Both axes list all groups in the selected annotation, so each square represents one group pair. Its color shows the co-occurrence score within the selected radius: orange to light yellow indicates more neighboring pairs than expected under random mixing, while blue indicates fewer pairs than expected. The matrix is symmetrical, and its diagonal shows whether cells from the same group cluster together.
More specifically, the score is the log2-transformed ratio between the observed and expected numbers of neighboring cell pairs:
The observed value is the number of pairs from groups and found within the selected radius. The expected value represents random mixing and is calculated as:
Here, is the total number of neighboring pairs, while and are the overall proportions of the two groups. Thus, a score of 0 means that there are as many observed pairs as expected, while scores of +1 and +2 indicate approximately 2× and 4× the expected number, respectively.
The radius can be swept: the tool’s panel offers Sweep from … to … in … steps under the Radius control. Run sweep runs the tool once per radius, all in one process, and a slider then moves between the results — the matrix and the table at each radius, every one the tool’s own answer at that radius, with nothing re-run while you drag. Seeing every radius, not only the one that looked best, is the point: a pair that is enriched at one radius and not at its neighbours is a pair to distrust.
| Parameter | Type | Default | What it does |
|---|---|---|---|
Radiusradius sweep |
float, 5–1,000 | 60 | Sets the maximum distance at which two cells count as neighbours, using the dataset’s own coordinate units. Check the scale bar and start with about two or three cell diameters. |
Grouping columnfield |
categorical_field | optional | Selects the annotation used to define the groups being compared. Defaults to the cell-type column. |
The nine gates this version passed when it was published.
Passed 9 of 9 gates
bundle
pass
4 files, 6.0 kB packed and 18.5 kB unpacked, plugin.json at the root.
manifest
pass
celltype-cooccurrence 1.2.0 by PointillViz reference tools; entry tool.py, outputs matrix, table, summary, 180 s and 2048 MB budget.
entry
pass
tool.py imported in 0.20 s and defines run(ds, params).
imports advisory
pass
1 Python file, importing backend, numpy; no network, subprocess, filesystem-write, dynamic-exec or environment use found.
fixture
pass
ran on the 600-cell fixture in 0.29 s of its 180 s budget, returning summary, table, matrix. A 3-step sweep over radius (5.0 to 1000.0) returned every step in 0.30 s.
result
pass
returned the declared outputs: summary, table, matrix.
determinism
pass
two runs with identical parameters produced byte-identical results (2.2 kB of JSON).
edge
pass
ran at the minimum corner (radius=5.0) in 0.28 s; ran at the maximum corner (radius=1000.0) in 0.29 s.
no_mutation
pass
the fixture dataset's 4 files are byte-identical after every run (plugin_cache/, where ds.knn caches, is excluded by design).
Passed every required gate when this version was published. That is a statement about the gates, not about whether the code is safe to run.
How mixed each cell’s neighbourhood is, and who sits next to whom.
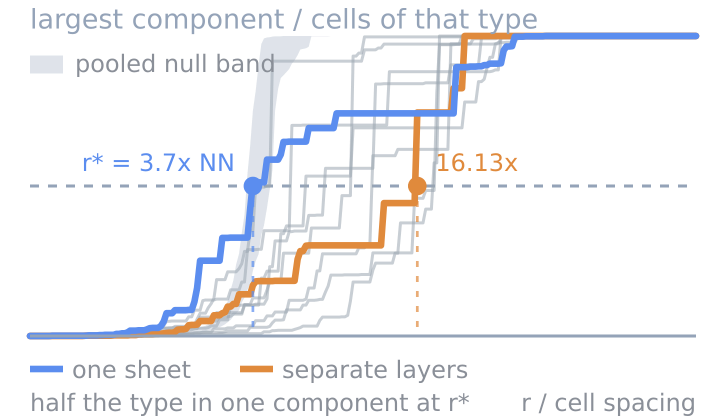
Whether a cell type is one connected mass or many islands.
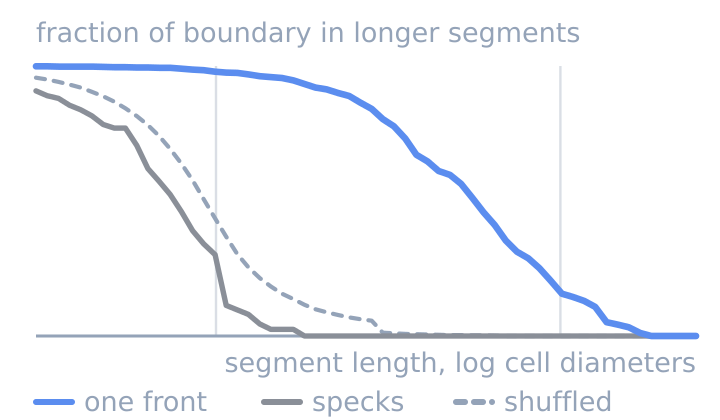
Whether two cell types meet along one front or in specks.