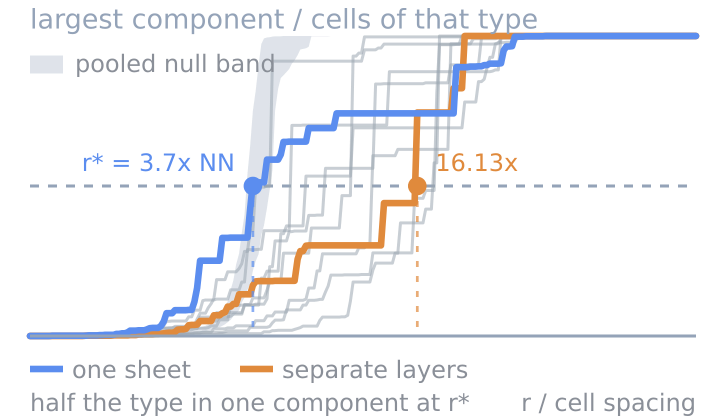
Cell-Type Percolation
Whether a cell type is one connected mass or many islands.
Verified: passed 9 of 9 gates
v1.0.0
4 downloads

by PointillViz reference tools
How crowded the tissue is around every cell.
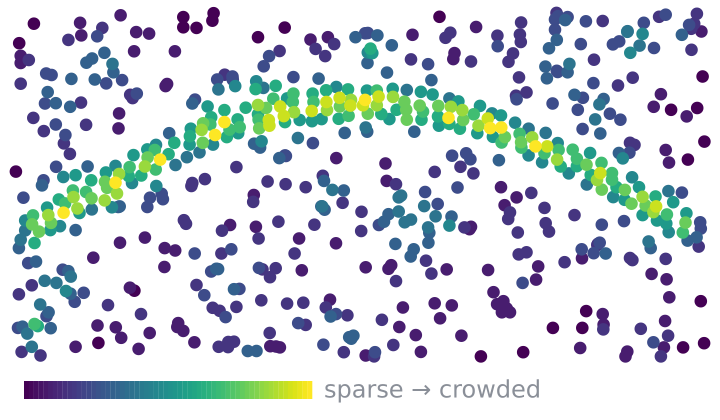
Answers the question: How densely are cells packed around each individual cell?
For each cell , the tool measures the distance to its -th nearest neighbour within the same section. This distance defines a circle in 2D or a sphere in 3D around the cell that contains its nearest neighbours. A smaller circle or sphere indicates more closely packed cells and therefore a higher local density. Local density is calculated as:
in 2D, and:
in 3D.
Map. Each cell is colored by its local density: brighter colors indicate higher density, darker colors lower density, and unpainted cells have no result.
Plot. Cells are sorted by local density. The x-axis shows the percentage of cells, and the y-axis shows the corresponding density. A point at (80%, y) means that 80% of cells have a local density of y or lower, while 20% have a higher density. At 50%, the curve therefore shows the median density.
| Parameter | Type | Default | What it does |
|---|---|---|---|
Neighbours (k)k |
int, 3–50 | 10 | Sets how many nearest neighbours are used to estimate local density. Larger values measure density over a broader area and produce a smoother result. |
Scalescale |
select, 2 options | log10 density | Sets whether density is shown directly or on a log10 scale. |
The nine gates this version passed when it was published.
Passed 9 of 9 gates
bundle
pass
4 files, 8.0 kB packed and 34.7 kB unpacked, plugin.json at the root.
manifest
pass
local-density 1.1.0 by PointillViz reference tools; entry tool.py, outputs cells, series, summary, 120 s and 2048 MB budget.
entry
pass
tool.py imported in 0.20 s and defines run(ds, params).
imports advisory
pass
1 Python file, importing numpy; no network, subprocess, filesystem-write, dynamic-exec or environment use found.
fixture
pass
ran on the 600-cell fixture in 0.28 s of its 120 s budget, returning summary, cells, series.
result
pass
returned the declared outputs: summary, cells, series.
determinism
pass
two runs with identical parameters produced byte-identical results (17.7 kB of JSON).
edge
pass
ran at the minimum corner (k=3) in 0.28 s; ran at the maximum corner (k=50, scale='linear') in 0.29 s.
no_mutation
pass
the fixture dataset's 4 files are byte-identical after every run (plugin_cache/, where ds.knn caches, is excluded by design).
Passed every required gate when this version was published. That is a statement about the gates, not about whether the code is safe to run.
Whether a cell type is one connected mass or many islands.
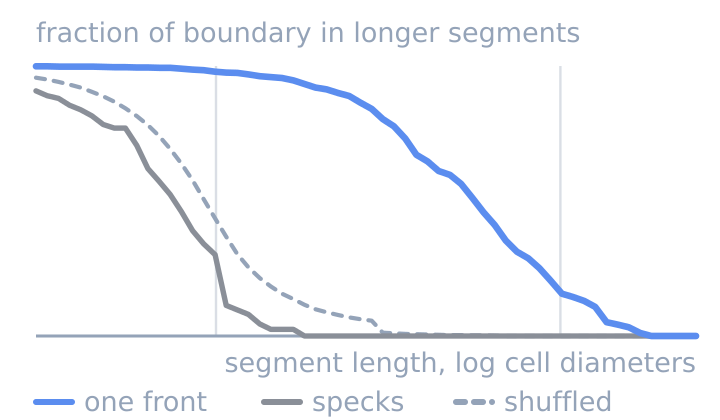
Whether two cell types meet along one front or in specks.
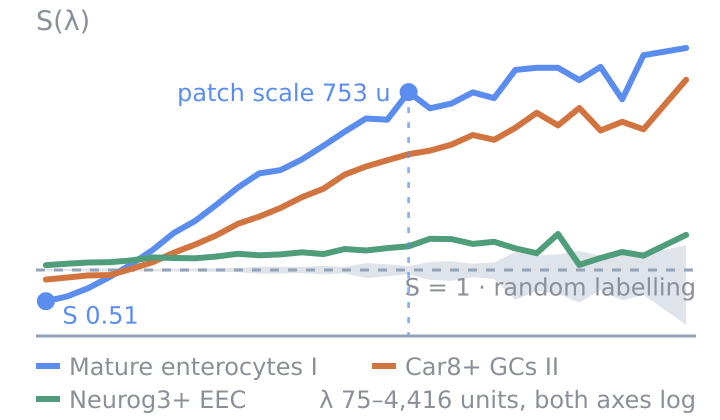
How clustered each cell type is, at every length scale.