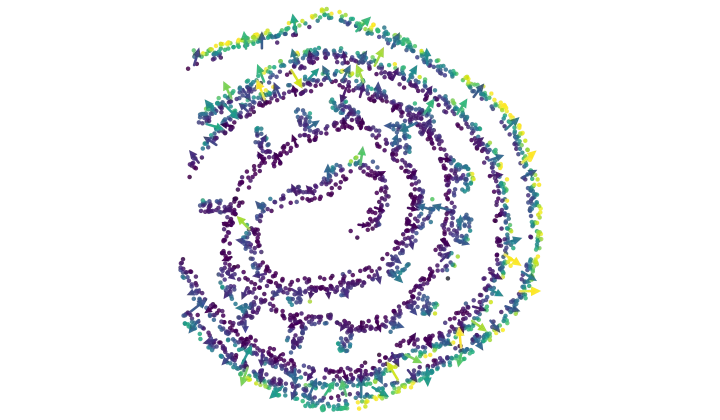
Vector Field
Which way a quantity increases across the tissue, as arrows over the section. Gene, cell type or any annotation column — with every arrow that could be noise removed.
Verified: passed 9 of 9 gates
v1.0.0
4 downloads

by PointillViz reference tools
Where one gene forms clusters of high or low expression.
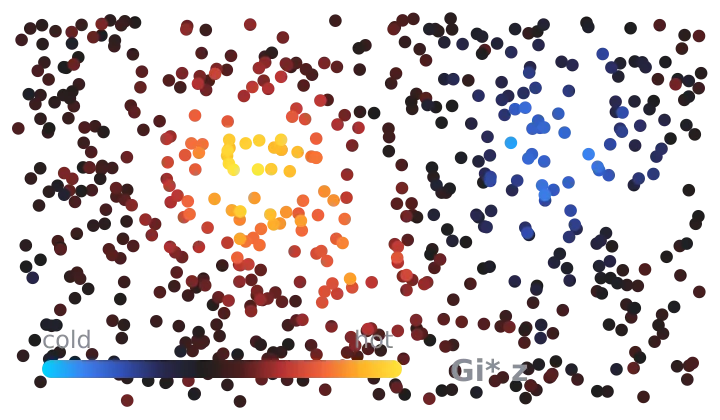
Answers the question: Where does a selected gene form spatial clusters of high or low expression?
For a selected gene, the tool considers each cell together with its nearest neighbours and calculates a Getis-Ord Gi* z-score. This score measures whether gene expression in that local neighbourhood is higher or lower than expected if the observed expression values were randomly distributed across the cells.
More specifically, the Gi* score expresses the difference between the observed and expected neighbourhood expression in units of the variation expected under random mixing:
Here, contains cell and its nearest neighbours, is its size, is the selected gene’s expression in cell , and and are its mean and standard deviation across all mapped cells.
Map. Each cell is colored by its Gi* z-score. Red shows locally elevated expression, while blue shows locally reduced expression. Because Gi* includes the cell itself, the map describes the expression level of the whole local region rather than whether one cell differs from its neighbours.
Summary. Gi* z-scores are converted into two-sided p-values and corrected across cells using the Benjamini–Hochberg method by default. Click the info icon after the run to see how many cells were classified as significant hotspots or coldspots at the selected q-value threshold.
Table. Each row represents one cell type. In hotspot and In coldspot count its cells in significant regions. Hotspot fraction gives the proportion of that cell type found in hotspots, while Mean Gi* shows its average hotspot score.
Getis & Ord (1992) Geographical Analysis 24(3):189-206; Ord & Getis (1995) Geographical Analysis 27(4):286-306.
| Parameter | Type | Default | What it does |
|---|---|---|---|
Genegene |
gene | — | Selects the gene analyzed for expression hotspots and coldspots. |
Neighbours (k)k |
int, 3–100 | 15 | Sets how many nearest neighbours are examined around each cell. Smaller values detect finer patterns; larger values detect broader patterns. |
Expression valuesnormalize |
select, 3 options | log1p(CP10K) | Sets the expression scale used in the calculation. log1p(CP10K) is recommended for most datasets; choose raw counts only when the original counts are required. |
Significance thresholdalpha |
float, 0.001–0.25 | 0.05 | Sets the largest p-value, or q-value when FDR correction is enabled, at which a cell is classified as a significant hotspot or coldspot. |
Benjamini-Hochberg FDRfdr |
bool | on | Corrects for testing many cells at once. When disabled, significance is based on uncorrected p-values and may include more false-positive hotspots or coldspots. |
The nine gates this version passed when it was published.
Passed 9 of 9 gates
bundle
pass
4 files, 19.0 kB packed and 70.3 kB unpacked, plugin.json at the root.
manifest
pass
expression-hotspots 1.1.0 by PointillViz reference tools; entry tool.py, outputs summary, cells, table, 120 s and 4096 MB budget.
entry
pass
tool.py imported in 0.21 s and defines run(ds, params).
imports advisory
pass
1 Python file, importing __future__, backend, numpy, scipy; no network, subprocess, filesystem-write, dynamic-exec or environment use found.
fixture
pass
ran on the 600-cell fixture in 0.74 s of its 120 s budget, returning summary, cells, table and 2 log lines.
result
pass
returned the declared outputs: summary, cells, table.
determinism
pass
two runs with identical parameters produced byte-identical results (13.1 kB of JSON).
edge
pass
ran at the minimum corner (alpha=0.001, fdr=False, k=3) in 0.66 s; ran at the maximum corner (alpha=0.25, k=100, normalize='raw') in 0.60 s.
no_mutation
pass
the fixture dataset's 4 files are byte-identical after every run (plugin_cache/, where ds.knn caches, is excluded by design).
Passed every required gate when this version was published. That is a statement about the gates, not about whether the code is safe to run.
Which way a quantity increases across the tissue, as arrows over the section. Gene, cell type or any annotation column — with every arrow that could be noise removed.
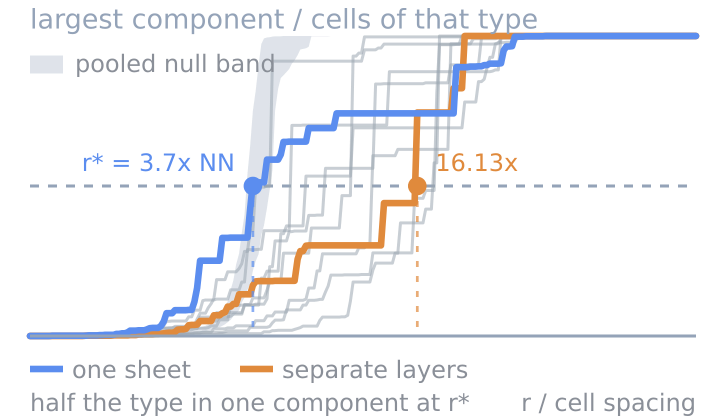
Whether a cell type is one connected mass or many islands.
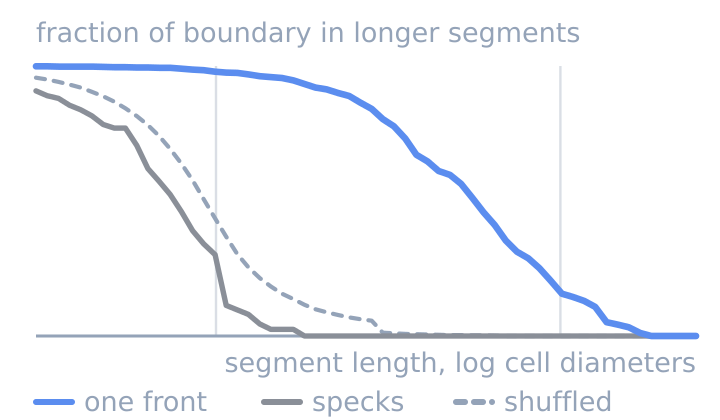
Whether two cell types meet along one front or in specks.