Cell-Type Percolation
Whether a cell type is one connected mass or many islands.
Verified: passed 9 of 9 gates
v1.0.0
4 downloads

by PointillViz community tools
How much one extra neighbour of type B changes the odds a cell is type A, holding every other type’s neighbour count fixed.
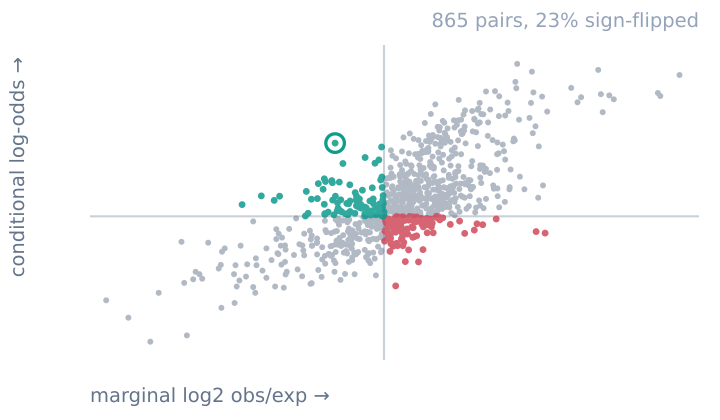
Answers the question: Which group pairs remain associated after the complete composition of each cell’s neighbourhood is taken into account?
The tool is based on a softmax model that relates each cell’s group identity to the composition of its local neighbourhood. The probability that cell belongs to group is modeled as:
Neighbourhoods are defined by an undirected -nearest-neighbour graph, and is the number of group- neighbours connected to cell . The model jointly estimates the group-specific offsets and the coefficients from the observed group labels. While accounts for the baseline tendency of a cell to belong to group , the main quantities of interest are the coefficients . They describe the association between groups and after the complete neighbourhood composition has been taken into account.
More precisely, while all other neighbour counts remain fixed, one additional -neighbour changes the log-odds of group versus group by .
Map. Using the fitted softmax model above, each cell is colored by , the log probability assigned to its observed group, given its neighbourhood. Values closer to 0 indicate that the model assigns a high probability to the observed group, while more negative values indicate that the cell’s identity is unusual for its neighbourhood.
Matrix. Both axes list all groups, and each square shows the corresponding fitted coefficient . The coefficients are centered to have a mean of zero, . Positive values indicate stronger-than-average conditional association; negative values indicate weaker association or relative avoidance. The diagonal shows conditional self-association.
Table. Each row represents one group pair. Conditional log-odds is the centered value from the matrix. Marginal log2 obs/exp is the Cell-Type Co-occurrence score calculated on the same neighbour graph, without accounting for other groups. Contacts is the number of observed connections between the groups. Rank shift shows how the pair’s position changes when pairs are ranked by conditional association instead of ordinary co-occurrence. A positive value means that the pair ranks higher by conditional association, while a negative value means that it ranks lower.
| Parameter | Type | Default | What it does |
|---|---|---|---|
Grouping columnfield |
categorical_field | optional | Selects the annotation used to define the groups. |
Neighbours (k)k |
int, 4–30 | 15 | Sets the number of nearest neighbours considered for each cell. Larger values include a broader neighbourhood but increase runtime. |
Ridgelam |
float, 0.01–100 | 1 | Controls how strongly coefficients are pulled toward zero. Higher values give more stable but more strongly smoothed estimates. |
Minimum cells per levelmin_cells |
int, 10–5,000 | 100 | Groups with fewer cells are not shown but remain included in the model. |
Level ceilingmax_levels |
int, 4–100 | 80 | Stops the analysis if the selected annotation contains more groups than this, limiting runtime and matrix size. |
Convergencegtol |
float, 0.000001–0.01 | 0.0001 | Sets when the model stops fitting. Smaller values require closer convergence but may take longer. |
The nine gates this version passed when it was published.
Passed 9 of 9 gates
bundle
pass
5 files, 21.3 kB packed and 72.0 kB unpacked, plugin.json at the root.
manifest
pass
conditional-contact-odds 1.0.0 by PointillViz community tools; entry tool.py, outputs summary, cells, matrix, table, 120 s and 4096 MB budget.
entry
pass
tool.py imported in 0.20 s and defines run(ds, params).
imports advisory
pass
2 Python files, importing backend, numpy, potts_core, scipy, time; no network, subprocess, filesystem-write, dynamic-exec or environment use found.
fixture
pass
ran on the 600-cell fixture in 0.48 s of its 120 s budget, returning summary, cells, table, matrix and 4 log lines.
result
pass
returned the declared outputs: summary, cells, table, matrix.
determinism
pass
two runs with identical parameters produced byte-identical results (14.2 kB of JSON).
edge
pass
at the minimum corner (gtol=1e-06, k=4, lam=0.01, max_levels=4, min_cells=10) it refused in words rather than crashing: This annotation has 6 levels and the level ceiling is set to 4. Pick a coarser grouping. (Cost climbs steeply with the level count as well: on a 135k-cell section 73 levels took 26 s at k=15 and 146 levels took 108 s at k=30.) (code: too_many_levels); at the maximum corner (gtol=0.01, k=30, lam=100.0, max_levels=100, min_cells=5000) it refused in words rather than crashing: No pair of levels clears the display gate: 5,000 cells in each level and 100 observed contacts between them. The largest level here has 238 cells and the busiest pair has 2,598 contacts. Lower the minimum, or group the annotation more coarsely. (code: nothing_reportable).
no_mutation
pass
the fixture dataset's 4 files are byte-identical after every run (plugin_cache/, where ds.knn caches, is excluded by design).
Passed every required gate when this version was published. That is a statement about the gates, not about whether the code is safe to run.
Whether a cell type is one connected mass or many islands.
Whether two cell types meet along one front or in specks.
How clustered each cell type is, at every length scale.